The Product Mix Report is a great way for you to track your costs. The benefit of this report is that it tells you how much you're making or losing on each item. You can view best sellers in a stacked bar graph or...
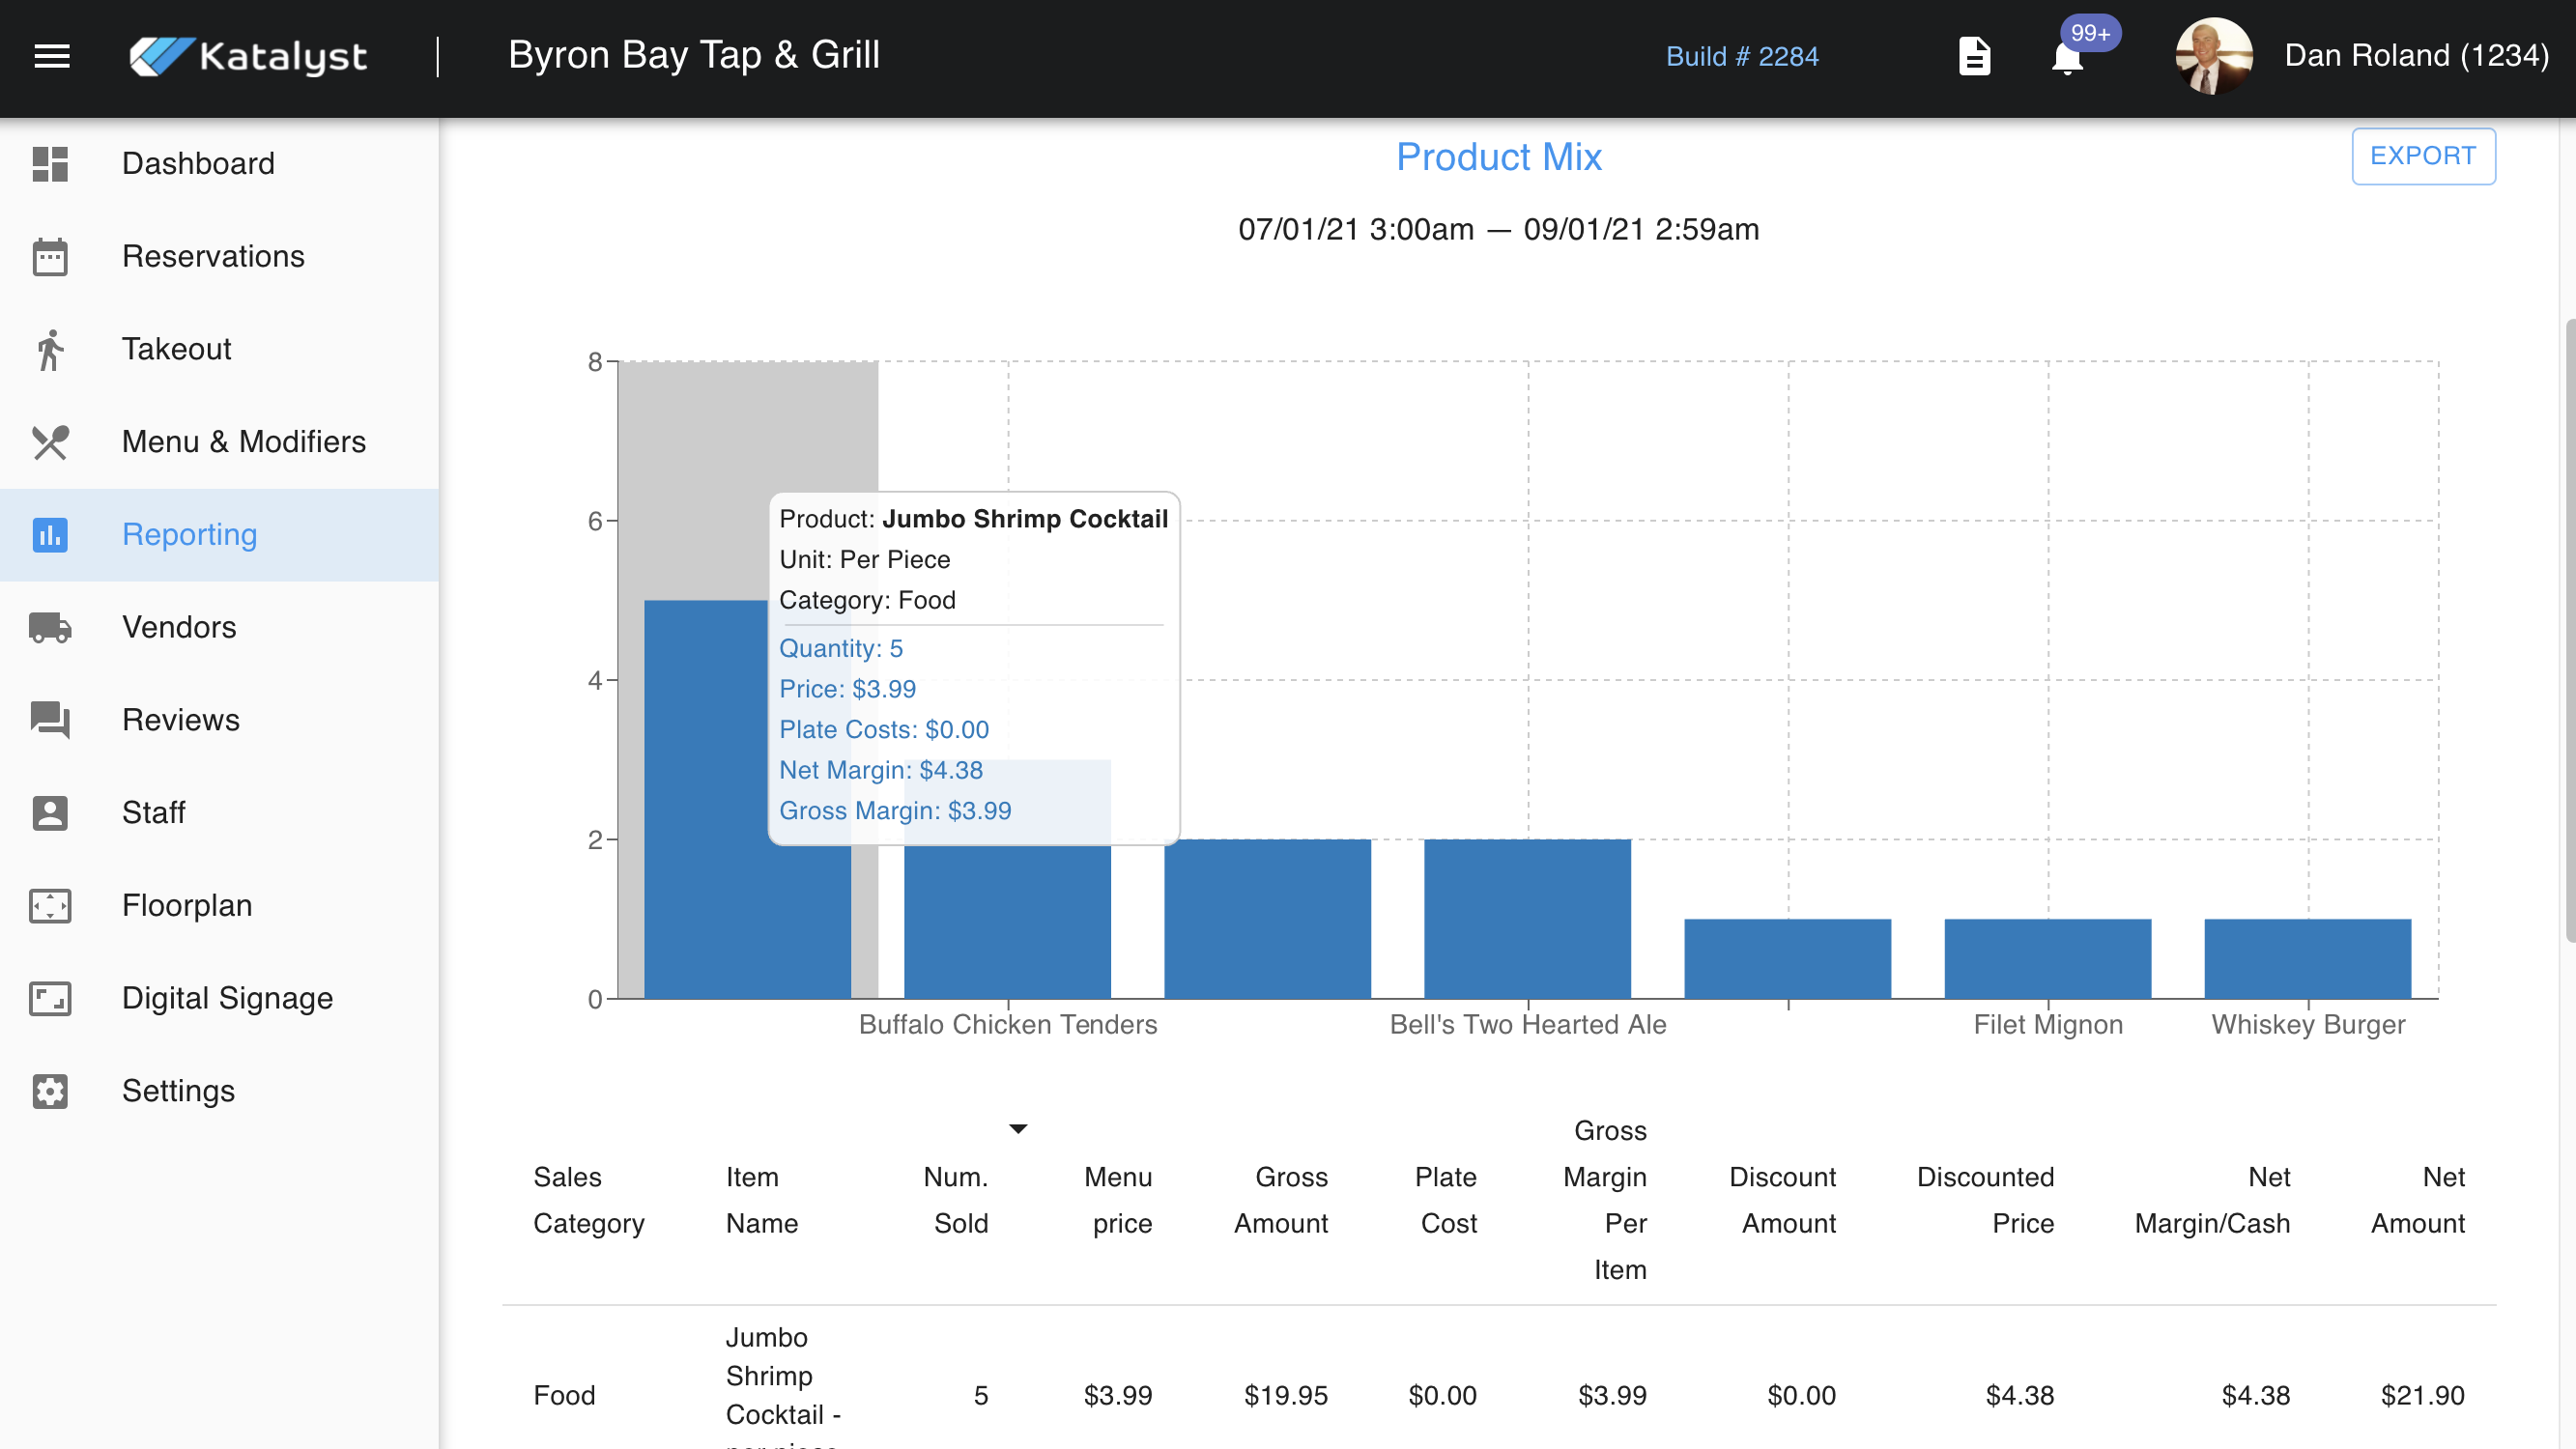
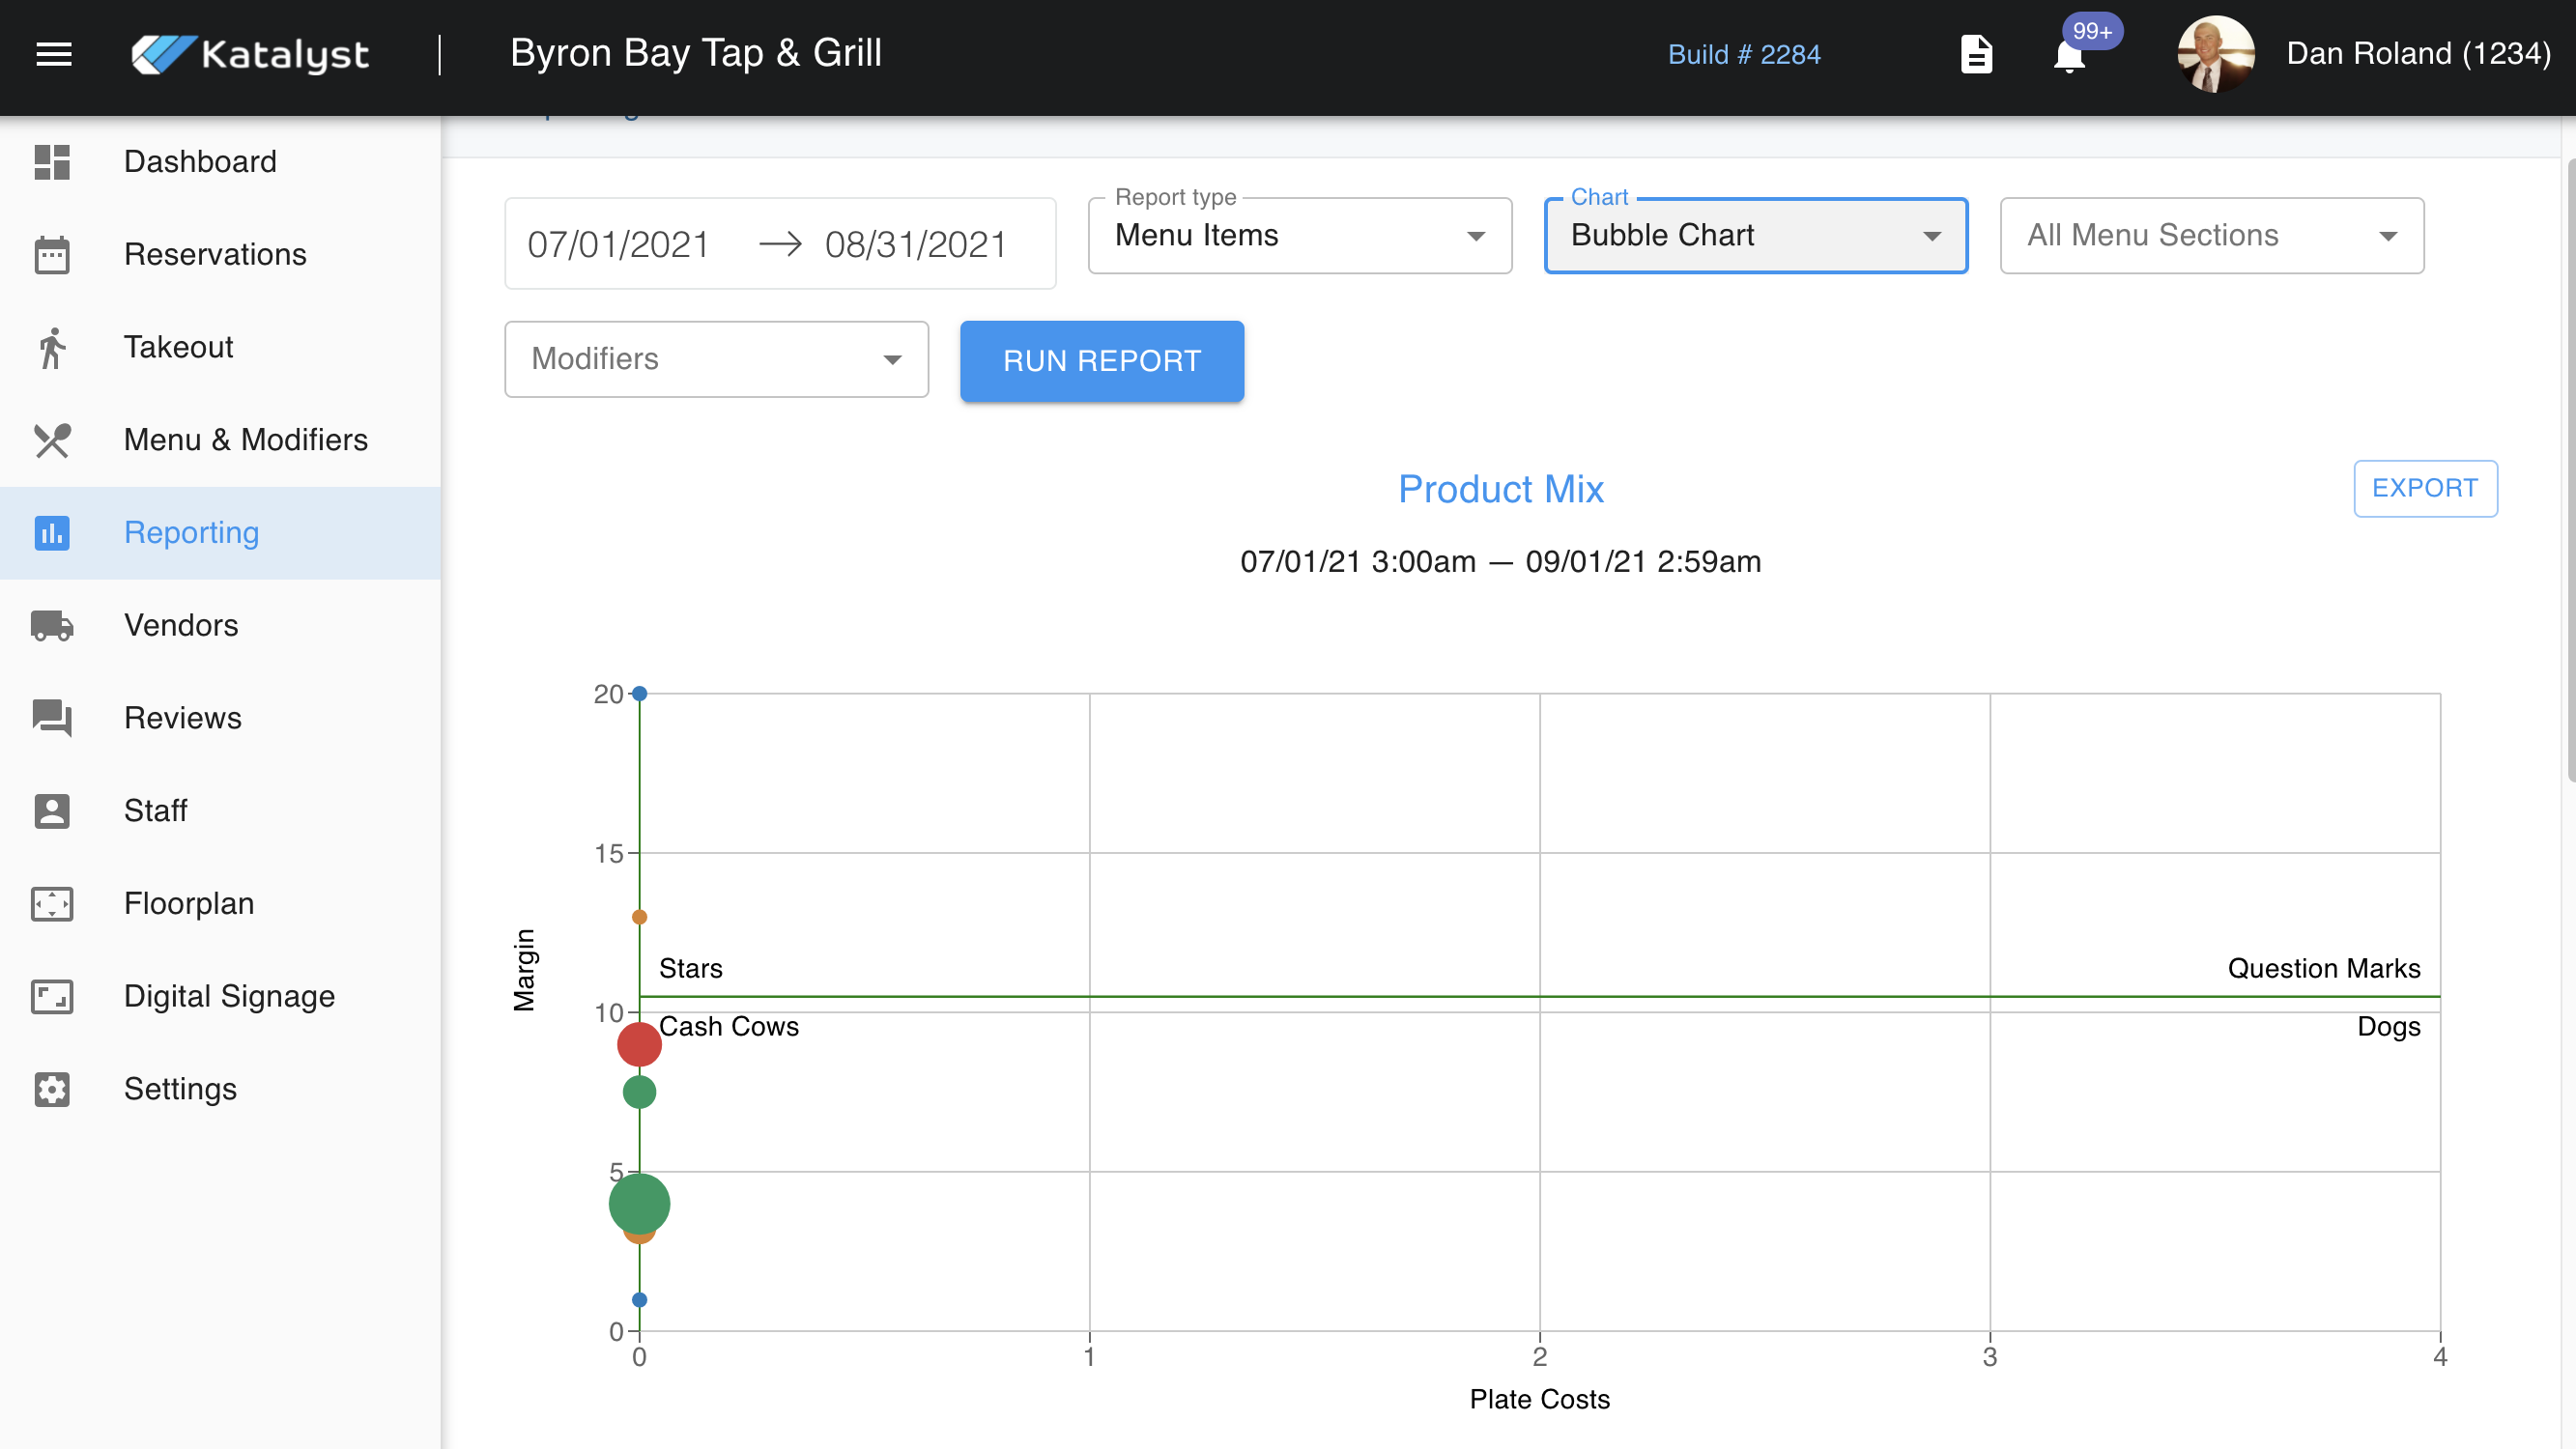
...as a bubble chart. You'll notice in the bubble chart that the terms, Stars and Cash Cows, are labeled on the chart below to the left. These names are used to describe the top earners. To the right are items that do not sell as well termed Question Marks and Dogs.
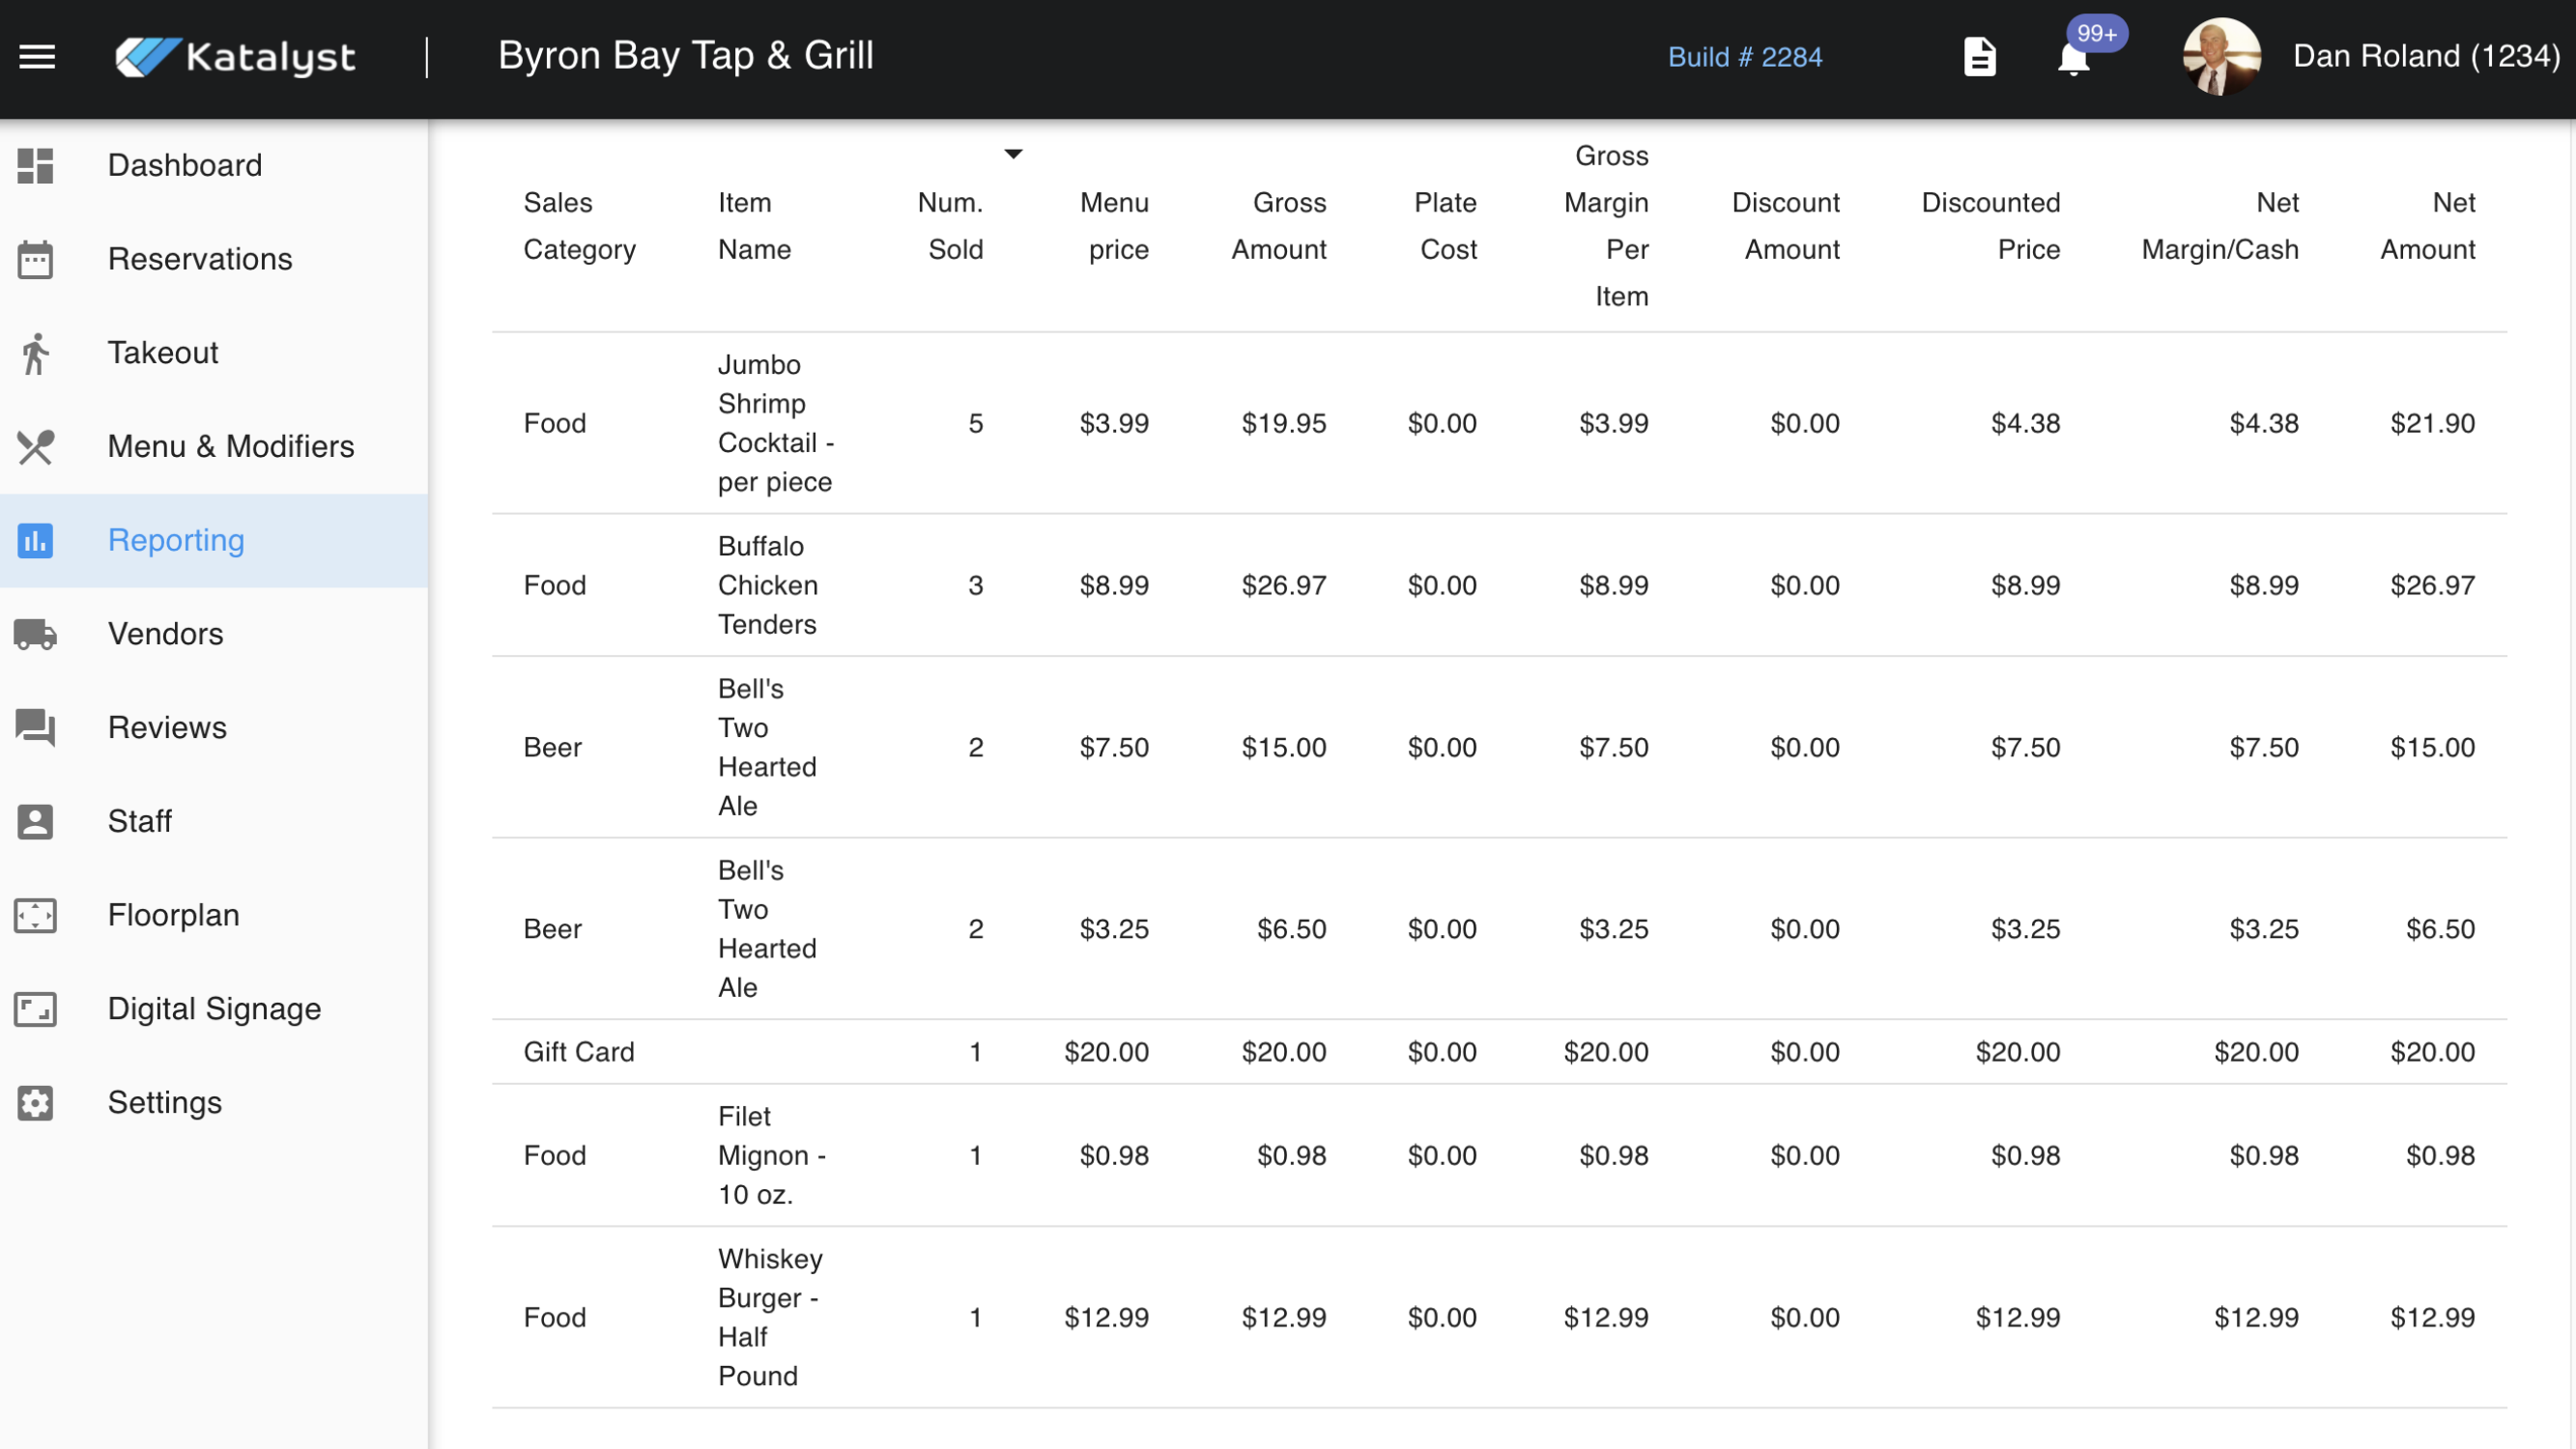
Below the charts is where the date that has produced the charts is. This data shows the item, how many were sold, menu price, gross made on the quantity sold, the actual cost per plate, the discount amount is applicable, net cash margin, and net amount.
We will be expanding on this once Cogswell is integrated...stay tuned.